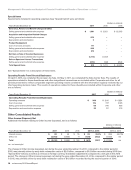
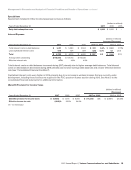
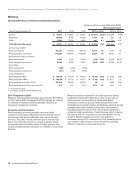
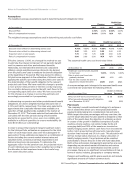
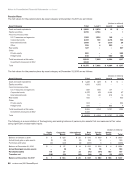
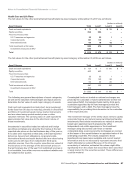
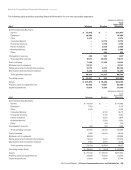
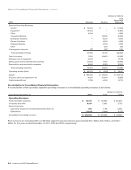
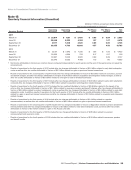
Notes to Consolidated Financial Statements continued (dollars in millions) 2015 Wireless Wireline Total Reportable Segments External Operating Revenues Service $ 70,305 $ — $ 70,305 Equipment 16,924 — 16,924 Other 4,294 — 4,294 Consumer Markets — 12,696 12,696 Enterprise Solutions — 9,376 9,376 Partner Solutions — 4,228 4,228 Business Markets — 3,553 3,553 Other — 330 330 Intersegment revenues 157 967 1,124 Total operating revenues 91,680 31,150 122,830 Cost of services 7,803 18,483 26,286 Wireless cost of equipment 23,119 — 23,119 Selling, general and administrative expense 21,805 7,140 28,945 Depreciation and amortization expense 8,980 6,353 15,333 Total operating expenses 61,707 31,976 93,683 Operating income (loss) $ 29,973 $ (826) $ 29,147 Assets $ 185,405 $ 78,305 $ 263,710 Property, plant and equipment, net 40,911 41,044 81,955 Capital expenditures 11,725 5,049 16,774 Reconciliation to Consolidated Financial Information A reconciliation of the reportable segment operating revenues to consolidated operating revenues is as follows: (dollars in millions) Years Ended December 31, 2017 2016 2015 Operating Revenues Total reportable segments $ 118,191 $ 119,696 $ 122,830 Corporate and other 9,019 5,663 3,738 Reconciling items: Operating results from divested businesses (Note 2) 368 2,115 6,224 Eliminations (1,544) (1,494) (1,172) Consolidated operating revenues $ 126,034 $ 125,980 $ 131,620 Fios revenues are included within our Wireline segment and amounted to approximately $11.7 billion, $11.2 billion, and $10.7 billion for the years ended December 31, 2017, 2016 and 2015, respectively. 94 verizon.com/2017AnnualReport
Purchased from Demo (abedemo.tizrapublisher.com) for the exclusive use of unknown.
© 2026 Demo. Please report unauthorized use to pirate@tizra.com