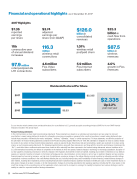
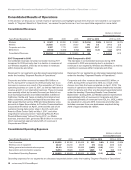
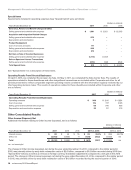
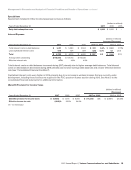
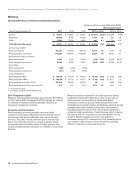
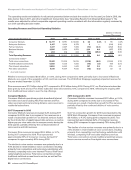
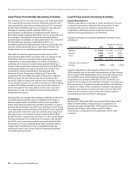
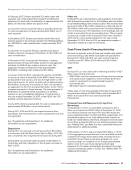
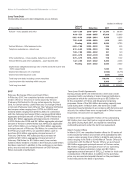
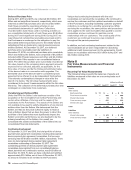
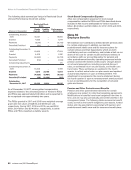
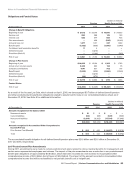
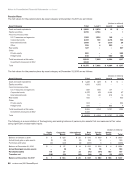
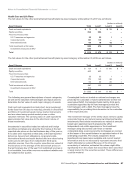
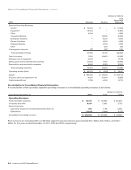
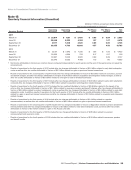
Management’s Discussion and Analysis of Financial Condition and Results of Operations continued Retail Postpaid Connections per Account Retail postpaid connections per account is calculated by dividing the total number of retail postpaid connections by the number of retail postpaid accounts as of the end of the period. Retail postpaid connections per account increased 2.0% as of December 31, 2017 compared to December 31, 2016. The increase in retail postpaid connections per account is primarily due to an increase in Internet devices, including tablets and other connected devices, which represented 19.0% of our retail postpaid connection base as of December 31, 2017 compared to 18.3% as of December 31, 2016. The increase in Internet devices is primarily driven by other connected devices, primarily wearables, as of December 31, 2017 compared to December 31, 2016. Service Revenue Service revenue, which does not include recurring device payment plan billings related to the Verizon device payment program, decreased by $3.5 billion, or 5.2%, during 2017 compared to 2016, primarily due to lower postpaid service revenue, including decreased overage revenue and decreased access revenue. Overage revenue pressure was primarily related to the introduction of unlimited pricing plans in 2017 and the ongoing migration to the pricing plans introduced in 2016 that feature safety mode and carryover data. Service revenue was also negatively impacted as a result of the ongoing customer migration to plans with unsubsidized service pricing. The pace of migration to unsubsidized price plans is approaching steady state, as the majority of customers are on such plans at December 31, 2017. Customer migration to unsubsidized service pricing was driven in part by an increase in the activation of devices purchased under the Verizon device payment program. For 2017, phone activations under the Verizon device payment program represented approximately 78% of retail postpaid phones activated compared to approximately 77% during 2016. At December 31, 2017, approximately 80% of our retail postpaid phone connections were on unsubsidized service pricing compared to approximately 67% at December 31, 2016. At December 31, 2017, approximately 49% of our retail postpaid phone connections have a current participation in the Verizon device payment program compared to approximately 46% at December 31, 2016. Service revenue plus recurring device payment plan billings related to the Verizon device payment program, which represents the total value received from our wireless connections, decreased $0.6 billion, or 0.8%, during 2017 compared to 2016. Retail postpaid ARPA (the average service revenue per account from retail postpaid accounts), which does not include recurring device payment plan billings related to the Verizon device payment program, was negatively impacted during 2017 compared to 2016, as a result of customer migration to plans with unsubsidized service pricing, including our new price plans launched during 2016, which feature safety mode and carryover data, and the introduction of unlimited data plans in 2017. Retail postpaid I-ARPA (the average service revenue per account from retail postpaid accounts plus recurring device payment plan billings), which represents the monthly recurring value received on a per account basis from our retail postpaid accounts, decreased 0.8% during 2017 compared to 2016. The decrease was driven by service revenue decline, partially offset by increasing recurring device payment plan billings. Equipment Revenue Equipment revenue increased $1.4 billion, or 7.8%, during 2017 compared to 2016, as a result of an increase in the Verizon device payment program take rate and an increase in the price of devices, partially offset by an overall decline in device sales. Under the Verizon device payment program, we recognize a higher amount of equipment revenue at the time of sale of devices. For 2017, phone activations under the Verizon device payment program represented approximately 78% of retail postpaid phones activated compared to approximately 77% during 2016. Other Revenue Other revenue includes non-service revenues such as regulatory fees, cost recovery surcharges, revenues associated with our device protection package, sublease rentals and financing revenue. Other revenue increased $0.4 billion, or 8.1%, during 2017 compared to 2016, primarily due to a $0.3 billion increase in financing revenues from our device payment program and a $0.2 billion volume-driven increase in revenues related to our device protection package. 2016 Compared to 2015 Wireless’ total operating revenues decreased by $2.5 billion, or 2.7%, during 2016 compared to 2015, primarily as a result of a decline in service revenue, partially offset by increases in equipment and other revenues. Accounts and Connections Retail postpaid connection net additions decreased during 2016 compared to 2015, primarily due to a decrease in retail postpaid connection gross additions as well as a higher retail postpaid connection churn rate. Retail Postpaid Connections per Account Retail postpaid connections per account increased 3.0% as of December 31, 2016 compared to December 31, 2015, primarily due to increases in Internet devices, which represented 18.3% of our retail postpaid connection base as of December 31, 2016 compared to 16.8% as of December 31, 2015. 2017 Annual Report | Verizon Communications Inc. and Subsidiaries 19
Purchased from Demo (abedemo.tizrapublisher.com) for the exclusive use of unknown.
© 2026 Demo. Please report unauthorized use to pirate@tizra.com