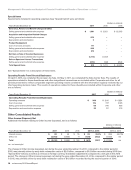
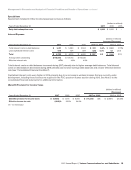
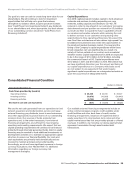
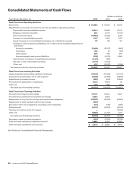
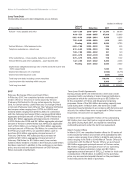
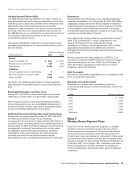
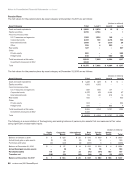
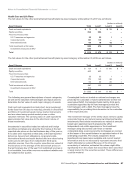
Management’s Discussion and Analysis of Financial Condition and Results of Operations continued Free Cash Flow Free cash flow is a non-GAAP financial measure that reflects an additional way of viewing our liquidity that, when viewed with our GAAP results, provides a more complete understanding of factors and trends affecting our cash flows. We believe it is a more conservative measure of cash flow since purchases of fixed assets are necessary for ongoing operations. Free cash flow has limitations due to the fact that it does not represent the residual cash flow available for discretionary expenditures. For example, free cash flow does not incorporate payments made on capital lease obligations or cash payments for business acquisitions. Therefore, we believe it is important to view free cash flow as a complement to our entire consolidated statements of cash flows. Free cash flow is calculated by subtracting capital expenditures from net cash provided by operating activities. The following table reconciles net cash provided by operating activities to Free cash flow: (dollars in millions) Years Ended December 31, 2017 2016 2015 Net cash provided by operating activities $ 25,305 $ 22,810 $ 39,027 Less Capital expenditures (including capitalized software) 17,247 17,059 17,775 Free cash flow $ 8,058 $ 5,751 $ 21,252 The changes in free cash flow during 2017, 2016 and 2015 were a result of the factors described in connection with net cash provided by operating activities and capital expenditures. The change in free cash flow during 2017 was primarily due to an increase in earnings and changes in working capital, partially offset by our discretionary contributions to qualified pension plans of $3.4 billion (approximately $2.1 billion, net of tax benefit) and the change in the method in which we monetize device payment plan receivables, as discussed below. As a result of the discretionary pension contribution in 2017, our mandatory pension funding through 2020 is expected to be minimal, which will benefit future cash flows. Further, the funded status of our qualified pension plan is improved. The change in free cash flow during 2016 was primarily due to a change in the method by which we monetize device payment plan receivables, as discussed below, as well as a decline in earnings, an increase in income taxes paid primarily as a result of the Access Line Sale and the fact that in 2015 we received $2.4 billion of cash proceeds as a result of our Tower Monetization Transaction with American Tower. During 2016, we changed the strategic method by which we monetize device payment plan receivables from sales of device payment plan receivables, which were recorded within cash flows provided by operating activities, to asset- backed debt transactions, which are recorded in cash flows from financing activities. During 2016 and 2015, we received cash proceeds related to sales of wireless device payment plan agreement receivables of approximately $2.0 billion and $7.2 billion, respectively. See Note 7 to the consolidated financial statements for additional information. During 2017 and 2016, we received proceeds from asset-backed debt transactions of approximately $4.3 billion and $5.0 billion, respectively. See Note 6 to the consolidated financial statements and “Cash Flows Used in Financing Activities” for additional information. Employee Benefit Plan Funded Status and Contributions Employer Contributions We operate numerous qualified and nonqualified pension plans and other postretirement benefit plans. These plans primarily relate to our domestic business units. During 2017, 2016 and 2015, contributions to our qualified pension plans were $4.0 billion, $0.8 billion and $0.7 billion, respectively. We also contributed $0.1 billion to our nonqualified pension plans each year in 2017, 2016 and 2015. The company’s overall investment strategy is to achieve a mix of assets that allows us to meet projected benefit payments while taking into consideration risk and return. In an effort to reduce the risk of our portfolio strategy and better align assets with liabilities, we have adopted a liability driven pension strategy that seeks to better match cash flows from investments with projected benefit payments. We expect that the strategy will reduce the likelihood that assets will decline at a time when liabilities increase (referred to as liability hedging), with the goal to reduce the risk of underfunding to the plan and its participants and beneficiaries however, we also expect the strategy to result in lower asset returns. Nonqualified pension contributions are estimated to be approximately $0.1 billion in 2018. Contributions to our other postretirement benefit plans generally relate to payments for benefits on an as-incurred basis since these other postretirement benefit plans do not have funding requirements similar to the pension plans. We contributed $1.3 billion, $1.1 billion and $0.9 billion to our other postretirement benefit plans in 2017, 2016 and 2015, respectively. Contributions to our other postretirement benefit plans are estimated to be approximately $0.8 billion in 2018. Leasing Arrangements See Note 5 to the consolidated financial statements for a discussion of leasing arrangements. 2017 Annual Report | Verizon Communications Inc. and Subsidiaries 35
Purchased from Demo (abedemo.tizrapublisher.com) for the exclusive use of unknown.
© 2026 Demo. Please report unauthorized use to pirate@tizra.com