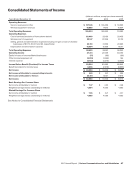
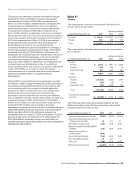
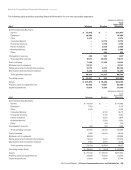
ConsolidatedStatementsofIncome (dollars in millions, except per share amounts) Years Ended December 31, 2017 2016 2015 Operating Revenues Service revenues and other $ 107,145 $ 108,468 $ 114,696 Wireless equipment revenues 18,889 17,512 16,924 Total Operating Revenues 126,034 125,980 131,620 Operating Expenses Cost of services (exclusive of items shown below) 29,409 29,186 29,438 Wireless cost of equipment 22,147 22,238 23,119 Selling, general and administrative expense (including net gain on sale of divested businesses of $1,774, $1,007 and $0, respectively) 30,110 31,569 29,986 Depreciation and amortization expense 16,954 15,928 16,017 Total Operating Expenses 98,620 98,921 98,560 Operating Income 27,414 27,059 33,060 Equity in losses of unconsolidated businesses (77) (98) (86) Other income (expense), net (2,010) (1,599) 186 Interest expense (4,733) (4,376) (4,920) Income Before Benefit (Provision) For Income Taxes 20,594 20,986 28,240 Benefit (provision) for income taxes 9,956 (7,378) (9,865) Net Income $ 30,550 $ 13,608 $ 18,375 Net income attributable to noncontrolling interests $ 449 $ 481 $ 496 Net income attributable to Verizon 30,101 13,127 17,879 Net Income $ 30,550 $ 13,608 $ 18,375 Basic Earnings Per Common Share Net income attributable to Verizon $ 7.37 $ 3.22 $ 4.38 Weighted-average shares outstanding (in millions) 4,084 4,080 4,085 Diluted Earnings Per Common Share Net income attributable to Verizon $ 7.36 $ 3.21 $ 4.37 Weighted-average shares outstanding (in millions) 4,089 4,086 4,093 See Notes to Consolidated Financial Statements 2017 Annual Report | Verizon Communications Inc. and Subsidiaries 47
Purchased from Demo (abedemo.tizrapublisher.com) for the exclusive use of unknown.
© 2026 Demo. Please report unauthorized use to pirate@tizra.com