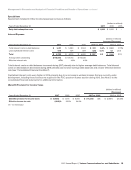
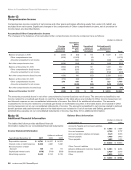
Notes to Consolidated Financial Statements continued Assumptions The weighted-average assumptions used in determining benefit obligations follow: Pension Health Care and Life At December 31, 2017 2016 2017 2016 Discount Rate 3.70% 4.30% 3.60% 4.20% Rate of compensation increases 3.00% 3.00% N/A N/A The weighted-average assumptions used in determining net periodic cost follow: Pension Health Care and Life At December 31, 2017 2016 2015 2017 2016 2015 Discount rate in effect for determining service cost 4.70% 4.50% 4.20% 4.60% 4.50% 4.20% Discount rate in effect for determining interest cost 3.40 3.20 4.20 3.50 3.40 4.20 Expected return on plan assets 7.70 7.00 7.25 4.50 3.80 4.80 Rate of compensation increases 3.00 3.00 3.00 N/A N/A N/A Effective January 1, 2016, we changed the method we use to estimate the interest component of net periodic benefit cost for pension and other postretirement benefits. Historically, we estimated the interest cost component utilizing a single weighted-average discount rate derived from the yield curve used to measure the benefit obligation at the beginning of the period. We have elected to utilize a full yield curve approach in the estimation of interest cost by applying the specific spot rates along the yield curve used in the determination of the benefit obligation to the relevant projected cash flows. We have made this change to provide a more precise measurement of interest cost by improving the correlation between projected benefit cash flows to the corresponding spot yield curve rates. We have accounted for this change as a change in accounting estimate and accordingly accounted for it prospectively. In determining our pension and other postretirement benefit obligations, we used a weighted-average discount rate of 3.70% and 3.60%, respectively. The rates were selected to approximate the composite interest rates available on a selection of high-quality bonds available in the market at December 31, 2017. The bonds selected had maturities that coincided with the time periods during which benefits payments are expected to occur, were non-callable and available in sufficient quantities to ensure marketability (at least $0.3 billion par outstanding). In order to project the long-term target investment return for the total portfolio, estimates are prepared for the total return of each major asset class over the subsequent 10- year period. Those estimates are based on a combination of factors including the current market interest rates and valuation levels, consensus earnings expectations and historical long-term risk premiums. To determine the aggregate return for the pension trust, the projected return of each individual asset class is then weighted according to the allocation to that investment area in the trust’s long- term asset allocation policy. The assumed health care cost trend rates follow: Health Care and Life At December 31, 2017 2016 2015 Healthcare cost trend rate assumed for next year 7.00% 6.50% 6.00% Rate to which cost trend rate gradually declines 4.50 4.50 4.50 Year the rate reaches the level it is assumed to remain thereafter 2026 2025 2024 A one-percentage point change in the assumed health care cost trend rate would have the following effects: (dollars in millions) One-Percentage Point Increase Decrease Effect on 2017 service and interest cost $ 25 $ (24) Effect on postretirement benefit obligation as of December 31, 2017 532 (516) Plan Assets The company’s overall investment strategy is to achieve a mix of assets that allows us to meet projected benefit payments while taking into consideration risk and return. While target allocation percentages will vary over time, the current target allocation for plan assets is designed so that 60% of the assets have the objective of achieving a return in excess of the growth in liabilities (comprised of public equities, private equities, real estate, hedge funds and emerging debt) and 38% of the assets are invested as liability hedging assets (where cash flows from investments better match projected benefit payments, typically longer duration fixed income) and 2% is in cash. This allocation will shift as funded status improves to a higher allocation of liability hedging assets. Target policies will be revisited periodically to ensure they are in line with fund objectives. Both active and passive management approaches are used depending on perceived market efficiencies and various other factors. Due to our diversification and risk control processes, there are no significant concentrations of risk, in terms of sector, industry, geography or company names. Pension and healthcare and life plans assets do not include significant amounts of Verizon common stock. 2017 Annual Report | Verizon Communications Inc. and Subsidiaries 85
Purchased from Demo (abedemo.tizrapublisher.com) for the exclusive use of unknown.
© 2026 Demo. Please report unauthorized use to pirate@tizra.com