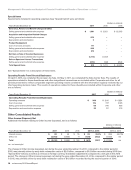
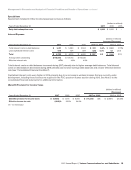
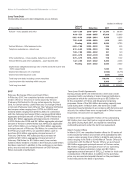
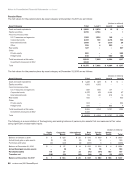
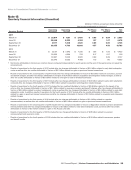
Management’s Discussion and Analysis of Financial Condition and Results of Operations continued Special Items Special items included in operating expenses (see “Special Items”) were as follows: (dollars in millions) Years Ended December 31, 2017 2016 2015 Severance, Pension and Benefit Charges (Credits) Selling, general and administrative expense $ 1,391 $ 2,923 $ (2,256) Acquisition and Integration Related Charges Selling, general and administrative expense 879 — — Depreciation and amortization 5 — — Product Realignment Cost of services and sales 171 — — Selling, general and administrative expense 292 — — Depreciation and amortization 219 — — Net Gain on Sale of Divested Businesses Selling, general and administrative expense (1,774) (1,007) — Gain on Spectrum License Transactions Selling, general and administrative expense (270) (142) (254) Total Special Items $ 913 $ 1,774 $ (2,510) See “Special Items” for a description of these items. Operating Results From Divested Businesses On April 1, 2016, we completed the Access Line Sale. On May 1, 2017, we completed the Data Center Sale. The results of operations related to these divestitures and other insignificant transactions are included within Corporate and other for all periods presented to reflect comparable segment operating results consistent with the information regularly reviewed by our chief operating decision maker. The results of operations related to these divestitures included within Corporate and other are as follows: (dollars in millions) Years Ended December 31, 2017 2016 2015 Operating Results From Divested Businesses Operating revenues $ 368 $ 2,115 $ 6,224 Cost of services 129 747 2,185 Selling, general and administrative expense 68 246 638 Depreciation and amortization expense 22 127 278 Other Consolidated Results Other Income (Expense), Net Additional information relating to Other income (expense), net is as follows: (dollars in millions) Increase/(Decrease) Years Ended December 31, 2017 2016 2015 2017 vs. 2016 2016 vs. 2015 Interest income $ 82 $ 59 $ 115 $ 23 39.0% $ (56) (48.7)% Other, net (2,092) (1,658) 71 (434) (26.2) (1,729) nm Total $ (2,010) $ (1,599) $ 186 $ (411) (25.7) $ (1,785) nm nm—not meaningful The change in Other income (expense), net during the year ended December 31, 2017, compared to the similar period in 2016, was primarily driven by early debt redemption costs of $2.0 billion, compared to $1.8 billion recorded during 2016 (see “Special Item” below), as well as a net loss on foreign currency translation adjustments compared to a net gain in the 2016 period. The change in Other income (expense), net during the year ended December 31, 2016, compared to the similar period in 2015, was primarily driven by early debt redemption costs of $1.8 billion recorded during the second quarter of 2016. 14 verizon.com/2017AnnualReport
Purchased from Demo (abedemo.tizrapublisher.com) for the exclusive use of unknown.
© 2026 Demo. Please report unauthorized use to pirate@tizra.com