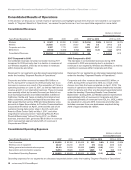
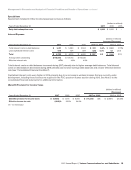
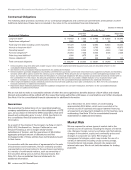
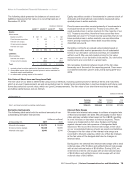
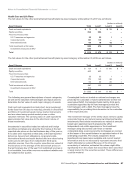
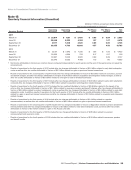
Management’s Discussion and Analysis of Financial Condition and Results of Operations continued Enterprise Solutions Enterprise Solutions helps customers deliver an adaptive enterprise, while mitigating risk and maintaining continuity, to capitalize on the data driven world and create personalized experiences. Enterprise Solutions provides professional and integrated managed services, delivering solutions for large businesses, including multinational corporations, and federal government customers. Enterprise Solutions offers traditional circuit-based network services, and advanced networking solutions including Private Internet Protocol (IP), Ethernet, and Software- Defined Wide Area Network, along with our traditional voice services and advanced workforce productivity and customer contact center solutions. Our Enterprise Solutions include security services to manage, monitor, and mitigate cyber-attacks. 2017 Compared to 2016 Enterprise Solutions revenues remained consistent during 2017 compared to 2016. Increased revenues resulting from the acquisition of XO were fully offset by declines in traditional data and voice communications services as a result of competitive price pressures. 2016 Compared to 2015 Enterprise Solutions revenues decreased $0.2 billion, or 2.3%, during 2016 compared to 2015, due to declines in traditional data and advanced networking solutions and voice communications services. Also contributing to the decrease was the negative impact of foreign exchange rates. Partner Solutions Partner Solutions provides communications services, including data, voice and local dial tone and broadband services primarily to local, long distance and other carriers that use our facilities to provide services to their customers. 2017 Compared to 2016 Partner Solutions revenues decreased 0.2% during 2017 compared to 2016, primarily due to declines in traditional voice revenues due to the effect of technology substitution, as well as continuing contraction of market rates due to competition, offset by revenues resulting from the acquisition of XO. As a result of technology substitution and the elimination of affiliate access lines due to the acquisition of XO, the number of core data circuits at December 31, 2017 decreased 26.8% compared to December 31, 2016. The decline in traditional voice revenue was driven by a 10.1% decline in domestic wholesale connections at December 31, 2017, compared to December 31, 2016. 2016 Compared to 2015 Partner Solutions revenues decreased $0.3 billion, or 5.0%, during 2016 compared to 2015, primarily due to declines in data revenues and traditional voice revenues driven by the effect of technology substitution as well as the continuing contraction of market rates due to competition. As a result of technology substitution, the number of core data circuits at December 31, 2016 decreased 16.3% compared to December 31, 2015. The decline in traditional voice revenue was driven by a 5.8% decline in domestic wholesale connections at December 31, 2016, compared to December 31, 2015. Business Markets Business Markets offers traditional voice and networking products, Fios services, IP Networking, advanced voice solutions, security, and managed IT services to U.S.-based small and medium businesses, state and local governments, and educational institutions. 2017 Compared to 2016 Business Markets revenues increased $0.2 billion, or 6.8%, during 2017 compared to 2016, primarily due to the acquisition of XO, partially offset by revenue declines related to the loss of voice and HSI connections as a result of competitive price pressures. 2016 Compared to 2015 Business Markets revenues decreased $0.2 billion, or 5.5%, during 2016 compared to 2015, primarily due to revenue declines related to the loss of voice connections as a result of competitive price pressures. Operating Expenses (dollars in millions) (Decrease)/Increase Years Ended December 31, 2017 2016 2015 2017 vs. 2016 2016 vs. 2015 Cost of services $ 17,922 $ 18,353 $ 18,483 $ (431) (2.3)% $ (130) (0.7)% Selling, general and administrative expense 6,274 6,476 7,140 (202) (3.1) (664) (9.3) Depreciation and amortization expense 6,104 5,975 6,353 129 2.2 (378) (5.9) Total Operating Expenses $ 30,300 $ 30,804 $ 31,976 $ (504) (1.6) $ (1,172) (3.7) 2017 Annual Report | Verizon Communications Inc. and Subsidiaries 23
Purchased from Demo (abedemo.tizrapublisher.com) for the exclusive use of unknown.
© 2026 Demo. Please report unauthorized use to pirate@tizra.com