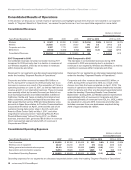
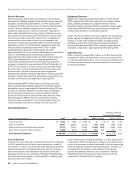
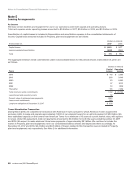
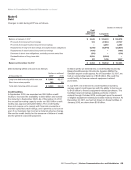
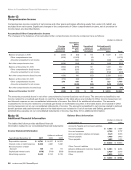
Management’s Discussion and Analysis of Financial Condition and Results of Operations continued Consolidated Results of Operations In this section, we discuss our overall results of operations and highlight special items that are not included in our segment results. In “Segment Results of Operations,” we review the performance of our two reportable segments in more detail. Consolidated Revenues (dollars in millions) (Decrease)/Increase Years Ended December 31, 2017 2016 2015 2017 vs. 2016 2016 vs. 2015 Wireless $ 87,511 $ 89,186 $ 91,680 $ (1,675) (1.9)% $ (2,494) (2.7)% Wireline 30,680 30,510 31,150 170 0.6 (640) (2.1) Corporate and other 9,387 7,778 9,962 1,609 20.7 (2,184) (21.9) Eliminations (1,544) (1,494) (1,172) (50) (3.3) (322) (27.5) Consolidated Revenues $ 126,034 $ 125,980 $ 131,620 $ 54 — $ (5,640) (4.3) 2017 Compared to 2016 Consolidated revenues remained consistent during 2017 compared to 2016 primarily due to a decline in revenues at our Wireless segment, offset by an increase in revenues within Corporate and other. Revenues for our segments are discussed separately below under the heading “Segment Results of Operations”. Corporate and other revenues increased $1.6 billion, or 20.7%, during 2017 compared to 2016 primarily due to an increase in revenue as a result of the acquisition of Yahoo’s operating business on June 13, 2017, as well as fleet service revenue growth in our telematics business. These increases were partially offset by the sale (Access Line Sale) of our local exchange business and related landline activities in California, Florida and Texas, including Fios Internet and video customers, switched and special access lines and high-speed Internet service (HSI) and long distance voice accounts in these three states, to Frontier Communications Corporation (Frontier) on April 1, 2016 and the sale of 23 customer-facing data center sites in the U.S. and Latin America (Data Center Sale) on May 1, 2017, and other insignificant transactions (see “Operating Results From Divested Businesses” below). During 2017, our Media business, branded Oath, generated $6.0 billion in revenues which represented approximately 64% of revenues in Corporate and Other. 2016 Compared to 2015 The decrease in consolidated revenues during 2016 compared to 2015 was primarily due to a decline in revenues at our segments, Wireless and Wireline, as well as a decline in revenues within Corporate and other. Revenues for our segments are discussed separately below under the heading “Segment Results of Operations”. Corporate and other revenues decreased $2.2 billion, or 21.9%, during 2016 compared to 2015 as a result of the Access Line Sale that was completed on April 1, 2016. The results of operations related to these divestitures included within Corporate and other are discussed separately below under the heading “Operating Results From Divested Businesses”. During 2016, our Media business represented approximately 46% of revenues in Corporate and other, comprised primarily of revenues from AOL Inc. (AOL), which we acquired on June 23, 2015. Corporate and other also includes revenues from new businesses acquired during 2016 of approximately $0.1 billion. Consolidated Operating Expenses (dollars in millions) Increase/(Decrease) Years Ended December 31, 2017 2016 2015 2017 vs. 2016 2016 vs. 2015 Cost of services $ 29,409 $ 29,186 $ 29,438 $ 223 0.8% $ (252) (0.9)% Wireless cost of equipment 22,147 22,238 23,119 (91) (0.4) (881) (3.8) Selling, general and administrative expense 30,110 31,569 29,986 (1,459) (4.6) 1,583 5.3 Depreciation and amortization expense 16,954 15,928 16,017 1,026 6.4 (89) (0.6) Consolidated Operating Expenses $ 98,620 $ 98,921 $ 98,560 $ (301) (0.3) $ 361 0.4 Operating expenses for our segments are discussed separately below under the heading “Segment Results of Operations”. 12 verizon.com/2017AnnualReport
Purchased from Demo (abedemo.tizrapublisher.com) for the exclusive use of unknown.
© 2026 Demo. Please report unauthorized use to pirate@tizra.com