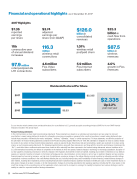
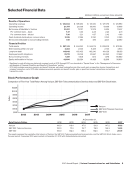
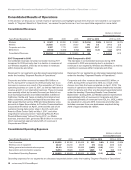
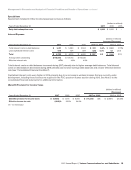
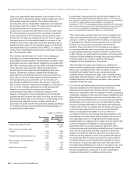
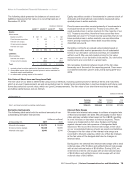
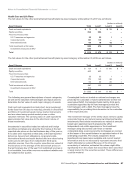
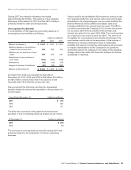
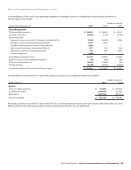
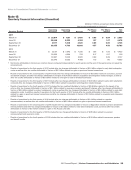
SelectedFinancialData (dollars in millions, except per share amounts) 2017 2016 2015 2014 2013 Results of Operations Operating revenues $ 126,034 $ 125,980 $ 131,620 $ 127,079 $ 120,550 Operating income 27,414 27,059 33,060 19,599 31,968 Net income attributable to Verizon 30,101 13,127 17,879 9,625 11,497 Per common share – basic 7.37 3.22 4.38 2.42 4.01 Per common share – diluted 7.36 3.21 4.37 2.42 4.00 Cash dividends declared per common share 2.335 2.285 2.230 2.160 2.090 Net income attributable to noncontrolling interests 449 481 496 2,331 12,050 Financial Position Total assets $ 257,143 $ 244,180 $ 244,175 $ 232,109 $ 273,184 Debt maturing within one year 3,453 2,645 6,489 2,735 3,933 Long-term debt 113,642 105,433 103,240 110,029 89,188 Employee benefit obligations 22,112 26,166 29,957 33,280 27,682 Noncontrolling interests 1,591 1,508 1,414 1,378 56,580 Equity attributable to Verizon 43,096 22,524 16,428 12,298 38,836 • Significant events affecting our historical earnings trends in 2015 through 2017 are described in “Special Items” in the “Management’s Discussion and Analysis of Financial Condition and Results of Operations” section. • 2014 data includes severance, pension and benefit charges, early debt redemption and other costs, gain on spectrum license transactions and wireless transaction costs. 2013 data includes severance, pension and benefit credits, gain on spectrum license transactions and wireless transaction costs. Stock Performance Graph Comparison of Five-Year Total Return Among Verizon, S&P 500 Telecommunications Services Index and S&P 500 Stock Index 2012 2013 2014 2015 2016 2017 $220 $200 $180 $160 $140 $120 $100 $80 Dollars Verizon S&P 500 Telecom Services S&P 500 At December 31, Data Points in Dollars 2012 2013 2014 2015 2016 2017 Verizon 100.0 118.4 117.8 121.9 147.2 153.2 S&P 500 Telecom Services 100.0 111.3 114.7 118.5 146.3 144.5 S&P 500 100.0 132.4 150.4 152.5 170.7 207.9 The graph compares the cumulative total returns of Verizon, the S&P 500 Telecommunications Services Index, and the S&P 500 Stock Index over a five-year period. It assumes $100 was invested on December 31, 2012 with dividends being reinvested. 2017 Annual Report | Verizon Communications Inc. and Subsidiaries 9
Purchased from Demo (abedemo.tizrapublisher.com) for the exclusive use of unknown.
© 2026 Demo. Please report unauthorized use to pirate@tizra.com