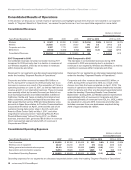
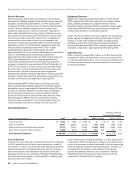
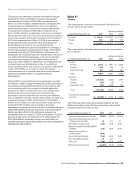
Management’s Discussion and Analysis of Financial Condition and Results of Operations continued Cost of Equipment Cost of equipment decreased $0.1 billion, or 0.4%, during 2017 compared to 2016, primarily as a result of a decline in the number of smartphone and internet units sold, substantially offset by a shift to higher priced units in the mix of devices sold. Cost of equipment decreased $0.9 billion, or 3.8%, during 2016 compared to 2015, primarily as a result of a 4.6% decline in the number of smartphone units sold, partially offset by an increase in the average cost per unit for smartphones. Selling, General and Administrative Expense Selling, general and administrative expense decreased $1.2 billion, or 5.8%, during 2017 compared to 2016, primarily due to a $0.6 billion decline in sales commission expense as well as a decline of approximately $0.2 billion in employee related costs primarily due to reduced headcount, as well as a decline in bad debt expense, non-income taxes and advertising expense. The decline in sales commission expense was driven by an increase in the proportion of activations under the Verizon device payment program, which has a lower commission per unit than activations under traditional fixed-term service plans, as well as an overall decline in activations. Selling, general and administrative expense decreased $1.9 billion, or 8.6%, during 2016 compared to 2015, primarily due to a $1.2 billion decline in sales commission expense as well as declines in employee related costs, non-income taxes, bad debt expense and advertising. The decline in sales commission expense was driven by an overall decline in activations as well as an increase in the proportion of activations under the Verizon device payment program, which has a lower commission per unit than activations under traditional fixed-term service plans. The decline in employee related costs was a result of reduced headcount. Depreciation and Amortization Expense Depreciation and amortization expense increased during 2017 and 2016 primarily driven by an increase in net depreciable assets. Segment Operating Income and EBITDA (dollars in millions) (Decrease)/Increase Years Ended December 31, 2017 2016 2015 2017 vs. 2016 2016 vs. 2015 Segment Operating Income $ 29,207 $ 29,853 $ 29,973 $(646) (2.2)% $ (120) (0.4)% Add Depreciation and amortization expense 9,395 9,183 8,980 212 2.3 203 2.3 Segment EBITDA $ 38,602 $ 39,036 $ 38,953 $(434) (1.1) $ 83 0.2 Segment operating income margin 33.4% 33.5% 32.7% Segment EBITDA margin 44.1% 43.8% 42.5% The changes in the table above during the periods presented were primarily a result of the factors described in connection with operating revenues and operating expenses. Wireline During the first quarter of 2017, Verizon reorganized the customer groups within its Wireline segment. Previously, the customer groups in the Wireline segment consisted of Mass Markets (which included Consumer Retail and Small Business subgroups), Global Enterprise and Global Wholesale. Pursuant to the reorganization, there are now four customer groups within the Wireline segment: Consumer Markets, which includes the customers previously included in Consumer Retail Enterprise Solutions, which includes the large business customers, including multinational corporations, and federal government customers previously included in Global Enterprise Partner Solutions, which includes the customers previously included in Global Wholesale and Business Markets, a new customer group, which includes U.S.-based small business customers previously included in Mass Markets and U.S.-based medium business customers, state and local government customers, and educational institutions previously included in Global Enterprise. The operating revenues from XO are included in the Wireline segment results as of February 2017, following the completion of the acquisition, and are included with the Enterprise Solutions, Partner Solutions and Business Markets customer groups. Total operating revenues of XO for the year ended December 31, 2017 were $1.1 billion. 2017 Annual Report | Verizon Communications Inc. and Subsidiaries 21
Purchased from Demo (abedemo.tizrapublisher.com) for the exclusive use of unknown.
© 2026 Demo. Please report unauthorized use to pirate@tizra.com