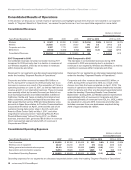
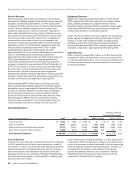
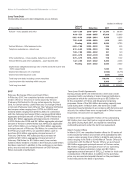
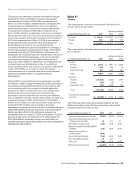
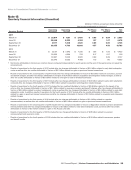
Management’s Discussion and Analysis of Financial Condition and Results of Operations continued Cost of Services Cost of services decreased $0.4 billion, or 2.3%, during 2017 compared to 2016, primarily due to the fact that we did not incur incremental costs in 2017 that were incurred in 2016 as a result of the 2016 Work Stoppage, as well as a decline in net pension and postretirement benefit costs primarily driven by collective bargaining agreements ratified in June 2016. These decreases were partially offset by an increase in content costs associated with continued programming license fee increases as well as an increase in access costs as a result of the acquisition of XO. Cost of services decreased $0.1 billion, or 0.7%, during 2016 compared to 2015, primarily due to a decline in net pension and postretirement benefit cost, and a decline in access costs driven by declines in overall wholesale long distance volumes and rates. These decreases were partially offset by incremental costs incurred as a result of the 2016 Work Stoppage as well as an increase in content costs associated with continued programming license fee increases and continued Fios subscriber growth. Selling, General and Administrative Expense Selling, general and administrative expense decreased $0.2 billion, or 3.1%, during 2017 compared to 2016, due to a decline in net pension and postretirement benefit costs, primarily driven by collective bargaining agreements ratified in June 2016 and the fact that there were no 2016 Work Stoppage costs in 2017, partially offset by a 9.5% increase in expenses resulting from the acquisition of XO. Selling, general and administrative expense decreased $0.7 billion, or 9.3%, during 2016 compared to 2015, primarily due to declines in employee costs as a result of reduced headcount, a decline in net pension and postretirement benefit costs and decreases in non-income taxes. Depreciation and Amortization Expense Depreciation and amortization expense increased during 2017 compared to 2016 primarily due to increases in net depreciable assets as a result of the acquisition of XO. Depreciation and amortization expense decreased during 2016 compared to 2015 primarily due to decreases in net depreciable assets. Segment Operating Income (Loss) and EBITDA (dollars in millions) Increase/(Decrease) Years Ended December 31, 2017 2016 2015 2017 vs. 2016 2016 vs. 2015 Segment Operating Income (Loss) $ 380 $ (294) $ (826) $ 674 nm $ 532 64.4% Add Depreciation and amortization expense 6,104 5,975 6,353 129 2.2% (378) (5.9) Segment EBITDA $ 6,484 $ 5,681 $ 5,527 $ 803 14.1 $ 154 2.8 Segment operating income (loss) margin 1.2% (1.0)% (2.7)% Segment EBITDA margin 21.1% 18.6% 17.7% nm—not meaningful The changes in the table above during the periods presented were primarily a result of the factors described in connection with operating revenues and operating expenses. 24 verizon.com/2017AnnualReport
Purchased from Demo (abedemo.tizrapublisher.com) for the exclusive use of unknown.
© 2026 Demo. Please report unauthorized use to pirate@tizra.com