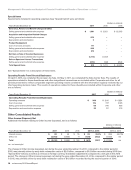
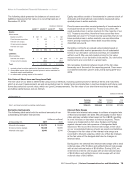
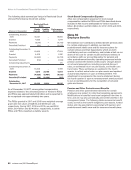
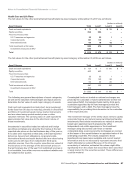
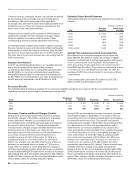
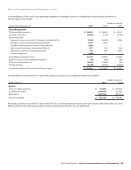
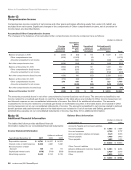
Notes to Consolidated Financial Statements continued Forward currency contracts, futures, and options are valued by the trustee at the exchange rates and market prices prevailing on the last business day of the year. Both exchange rates and market prices are readily available from published sources. These securities are classified by the asset class of the underlying holdings. Hedge funds are valued by the custodian at NAV based on statements received from the investment manager. These funds are valued in accordance with the terms of their corresponding offering or private placement memoranda. Commingled funds, hedge funds, venture capital, corporate finance, natural resource and real estate limited partnership investments for which fair value is measured using the NAV per share as a practical expedient are not leveled within the fair value hierarchy and are included as a reconciling item to total investments. Employer Contributions In 2017, we contributed $4.0 billion to our qualified pension plans, which included $3.4 billion of discretionary contributions, $0.1 billion to our nonqualified pension plans and $1.3 billion to our other postretirement benefit plans. Nonqualified pension plans contributions are estimated to be $0.1 billion and contributions to our other postretirement benefit plans are estimated to be $0.8 billion in 2018. Estimated Future Benefit Payments The benefit payments to retirees are expected to be paid as follows: (dollars in millions) Year Pension Benefits Health Care and Life 2018 $ 2,401 $ 1,246 2019 2,098 1,249 2020 1,464 1,297 2021 1,212 1,318 2022 1,161 1,336 2023 to 2027 5,526 6,277 Savings Plan and Employee Stock Ownership Plans We maintain four leveraged employee stock ownership plans (ESOP). We match a certain percentage of eligible employee contributions to certain savings plans with shares of our common stock from this ESOP. At December 31, 2017, the number of allocated shares of common stock in this ESOP was 53 million. There were no unallocated shares of common stock in this ESOP at December 31, 2017. All leveraged ESOP shares are included in earnings per share computations. Total savings plan costs were $0.8 billion in 2017, $0.7 billion in 2016 and $0.9 billion in 2015. Severance Benefits The following table provides an analysis of our severance liability recorded in accordance with the accounting standard regarding employers’ accounting for postemployment benefits: (dollars in millions) Year Beginning of Year Charged to Expense Payments Other End of Year 2015 $ 875 $ 551 $ (619) $ (7) $ 800 2016 800 417 (583) 22 656 2017 656 581 (564) (46) 627 Severance, Pension and Benefit Charges (Credits) During 2017, we recorded net pre-tax severance, pension and benefit charges of $1.4 billion, exclusive of acquisition related severance charges, in accordance with our accounting policy to recognize actuarial gains and losses in the period in which they occur. The pension and benefit remeasurement charges of approximately $0.9 billion were primarily driven by a decrease in our discount rate assumption used to determine the current year liabilities of our pension and postretirement benefit plans from a weighted-average of 4.2% at December 31, 2016 to a weighted-average of 3.7% at December 31, 2017 ($2.6 billion). The charges were partially offset by the difference between our estimated return on assets of 7.0% and our actual return on assets of 14.0% ($1.2 billion), a change in mortality assumptions primarily driven by the use of updated actuarial tables (MP-2017) issued by the Society of Actuaries ($0.2 billion) and other assumption adjustments ($0.3 billion). As part of these charges, we also recorded severance costs of $0.5 billion under our existing separation plans. During 2016, we recorded net pre-tax severance, pension and benefit charges of $2.9 billion in accordance with our accounting policy to recognize actuarial gains and losses in the period in which they occur. The pension and benefit remeasurement charges of $2.5 billion were primarily driven by a decrease in our discount rate assumption used to determine the current year liabilities of our pension and other postretirement benefit plans from a weighted-average of 4.6% at December 31, 2015 to a weighted-average of 4.2% at December 31, 2016 ($2.1 billion), updated health care trend cost assumptions ($0.9 billion), the difference between our estimated return on assets of 7.0% and our actual return on assets of 6.0% ($0.2 billion) and other assumption adjustments ($0.3 billion). These charges were partially offset by a change in mortality assumptions primarily driven by the use of updated actuarial tables (MP- 2016) issued by the Society of Actuaries ($0.5 billion) and lower negotiated prescription drug pricing ($0.5 billion). As part of these charges, we also recorded severance costs of $0.4 billion under our existing separation plans. 88 verizon.com/2017AnnualReport
Purchased from Demo (abedemo.tizrapublisher.com) for the exclusive use of unknown.
© 2026 Demo. Please report unauthorized use to pirate@tizra.com