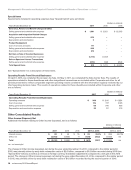
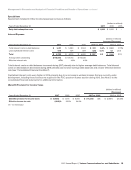
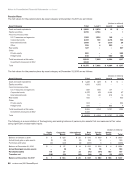
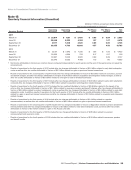
Management’s Discussion and Analysis of Financial Condition and Results of Operations continued Special Item Special item included in Other income (expense), net was as follows: (dollars in millions) Years Ended December 31, 2017 2016 2015 Early debt redemption costs $ 1,983 $ 1,822 $ — Interest Expense (dollars in millions) Increase/(Decrease) Years Ended December 31, 2017 2016 2015 2017 vs. 2016 2016 vs. 2015 Total interest costs on debt balances $ 5,411 $ 5,080 $ 5,504 $ 331 6.5% $ (424) (7.7)% Less capitalized interest costs 678 704 584 (26) (3.7) 120 20.5 Total $ 4,733 $ 4,376 $ 4,920 $ 357 8.2 $ (544) (11.1) Average debt outstanding $ 115,693 $ 106,113 $ 112,838 Effective interest rate 4.7% 4.8% 4.9% Total interest costs on debt balances increased during 2017 primarily due to higher average debt balances. Total interest costs on debt balances decreased during 2016 primarily due to lower average debt balances and a lower effective interest rate (see “Consolidated Financial Condition”). Capitalized interest costs were higher in 2016 primarily due to an increase in wireless licenses that are currently under development, including those licenses we acquired in the FCC spectrum license auction during 2015. See Note 2 to the consolidated financial statements for additional information. (Benefit) Provision for Income Taxes (dollars in millions) (Decrease) Years Ended December 31, 2017 2016 2015 2017 vs. 2016 2016 vs. 2015 (Benefit) provision for income taxes $ (9,956) $ 7,378 $ 9,865 $ (17,334) nm $ (2,487) (25.2)% Effective income tax rate (48.3)% 35.2% 34.9% nm—not meaningful 2017 Annual Report | Verizon Communications Inc. and Subsidiaries 15
Purchased from Demo (abedemo.tizrapublisher.com) for the exclusive use of unknown.
© 2026 Demo. Please report unauthorized use to pirate@tizra.com