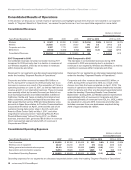
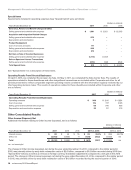
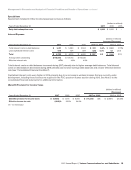
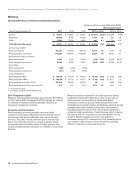
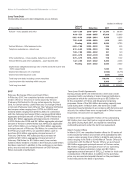
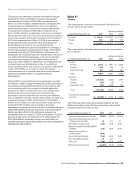
Management’s Discussion and Analysis of Financial Condition and Results of Operations continued Service Revenue Service revenue, which does not include recurring device payment plan billings related to the Verizon device payment program, decreased by $3.8 billion, or 5.4%, during 2016 compared to 2015, primarily driven by lower retail postpaid service revenue. Retail postpaid service revenue was negatively impacted as a result of customer migration to plans with unsubsidized service pricing, including our new price plans launched during 2016 that feature safety mode and carryover data. Customer migration to unsubsidized service pricing was driven in part by an increase in the activation of devices purchased under the Verizon device payment program. For 2016, phone activations under the Verizon device payment program were 77% of retail postpaid phones activated. At December 31, 2016, approximately 67% of our retail postpaid phone connections were on unsubsidized service pricing compared to approximately 42% at December 31, 2015. At December 31, 2016, approximately 46% of our retail postpaid phone connections participated in the Verizon device payment program compared to approximately 29% at December 31, 2015. The decrease in service revenue was partially offset by an increase in retail postpaid connections compared to the prior year. Service revenue plus recurring device payment plan billings related to the Verizon device payment program, which represents the total value received from our wireless connections, increased 2.0% during 2016. Retail postpaid ARPA, which does not include recurring device payment plan billings related to the Verizon device payment program, was negatively impacted during 2016 as a result of customer migration to plans with unsubsidized service pricing, including our new price plans launched during 2016 that feature safety mode and carryover data. Retail postpaid I-ARPA, which represents the monthly recurring value received on a per account basis from our retail postpaid accounts, increased 2.5% during 2016. Equipment Revenue Equipment revenue increased $0.6 billion, or 3.5%, during 2016 compared to 2015, as a result of an increase in device sales, primarily smartphones, under the Verizon device payment program, partially offset by a decline in device sales under the traditional fixed-term service plans, promotional activity and a decline in overall sales volumes. Under the Verizon device payment program, we recognize a higher amount of equipment revenue at the time of sale of devices. For the year ended December 31, 2016, phone activations under the Verizon device payment program represented approximately 70% of retail postpaid phones activated compared to approximately 54% during 2015. Other Revenue Other revenue increased $0.7 billion, or 16.8%, during 2016 compared to 2015, primarily due to financing revenues from our device payment program, cost recovery surcharges and a volume-driven increase in revenues related to our device protection package. Operating Expenses (dollars in millions) Increase/(Decrease) Years Ended December 31, 2017 2016 2015 2017 vs. 2016 2016 vs. 2015 Cost of services $ 7,990 $ 7,988 $ 7,803 $ 2 —% $ 185 2.4% Cost of equipment 22,147 22,238 23,119 (91) (0.4) (881) (3.8) Selling, general and administrative expense 18,772 19,924 21,805 (1,152) (5.8) (1,881) (8.6) Depreciation and amortization expense 9,395 9,183 8,980 212 2.3 203 2.3 Total Operating Expenses $ 58,304 $ 59,333 $ 61,707 $ (1,029) (1.7) $ (2,374) (3.8) Cost of Services Cost of services remained consistent during 2017 compared to 2016, primarily due to higher rent expense as a result of an increase in macro and small cell sites supporting network capacity expansion and densification, as well as a volume- driven increase in costs related to the device protection package offered to our customers. Partially offsetting these increases were decreases in costs related to roaming, long distance and cost of data. Cost of services increased $0.2 billion, or 2.4%, during 2016 compared to 2015, primarily due to higher rent expense as a result of an increase in macro and small cell sites supporting network capacity expansion and densification, as well as a volume-driven increase in costs related to the device protection package offered to our customers. Partially offsetting these increases were decreases in network connection costs and cost of roaming. 20 verizon.com/2017AnnualReport
Purchased from Demo (abedemo.tizrapublisher.com) for the exclusive use of unknown.
© 2026 Demo. Please report unauthorized use to pirate@tizra.com