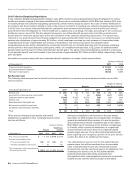
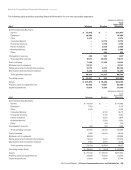
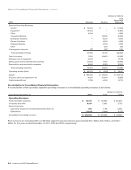
Notes to Consolidated Financial Statements continued Pension Plans The fair values for the pension plans by asset category at December 31, 2017 are as follows: (dollars in millions) Asset Category Total Level 1 Level 2 Level 3 Cash and cash equivalents $ 2,889 $ 2,874 $ 15 $ — Equity securities 2,795 2,794 — 1 Fixed income securities U.S. Treasuries and agencies 1,382 1,234 148 — Corporate bonds 2,961 139 2,718 104 International bonds 1,068 17 1,031 20 Other 396 4 392 — Real estate 627 — — 627 Other Private equity 580 — — 580 Hedge funds 845 — 660 185 Total investments at fair value 13,543 7,062 4,964 1,517 Investments measured at NAV 5,632 Total $ 19,175 $ 7,062 $ 4,964 $ 1,517 The fair values for the pension plans by asset category at December 31, 2016 are as follows: (dollars in millions) Asset Category Total Level 1 Level 2 Level 3 Cash and cash equivalents $ 1,228 $ 1,219 $ 9 $ — Equity securities 1,883 1,883 — — Fixed income securities U.S. Treasuries and agencies 1,251 880 371 — Corporate bonds 2,375 152 2,126 97 International bonds 713 20 679 14 Real estate 655 — — 655 Other Private equity 624 — — 624 Hedge funds 526 — 522 4 Total investments at fair value 9,255 4,154 3,707 1,394 Investments measured at NAV 5,408 Total $ 14,663 $ 4,154 $ 3,707 $ 1,394 The following is a reconciliation of the beginning and ending balance of pension plan assets that are measured at fair value using significant unobservable inputs: (dollars in millions) Equity Securities Corporate Bonds International Bonds Real Estate Private Equity Hedge Funds Total Balance at January 1, 2016 $ 3 $ 128 $ 20 $ 873 $ 609 $ — $ 1,633 Actual (loss) gain on plan assets (1) (9) (2) 169 12 — 169 Purchases and sales (2) (22) (4) (387) 3 4 (408) Balance at December 31, 2016 $ — $ 97 $ 14 $ 655 $ 624 $ 4 $ 1,394 Actual (loss) gain on plan assets — (1) — 76 78 — 153 Purchases (sales) 119 27 22 (70) (114) 183 167 Transfers out (118) (19) (16) (34) (8) (2) (197) Balance at December 31, 2017 $ 1 $ 104 $ 20 $ 627 $ 580 $ 185 $ 1,517 86 verizon.com/2017AnnualReport
Purchased from Demo (abedemo.tizrapublisher.com) for the exclusive use of unknown.
© 2026 Demo. Please report unauthorized use to pirate@tizra.com