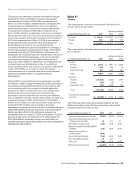
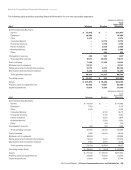
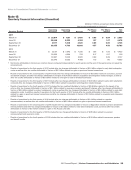
Notes to Consolidated Financial Statements continued The following table provides operating financial information for our two reportable segments: (dollars in millions) 2017 Wireless Wireline Total Reportable Segments External Operating Revenues Service $ 62,972 $ — $ 62,972 Equipment 18,889 — 18,889 Other 5,270 — 5,270 Consumer Markets — 12,775 12,775 Enterprise Solutions — 9,165 9,165 Partner Solutions — 3,969 3,969 Business Markets — 3,585 3,585 Other — 234 234 Intersegment revenues 380 952 1,332 Total operating revenues 87,511 30,680 118,191 Cost of services 7,990 17,922 25,912 Wireless cost of equipment 22,147 — 22,147 Selling, general and administrative expense 18,772 6,274 25,046 Depreciation and amortization expense 9,395 6,104 15,499 Total operating expenses 58,304 30,300 88,604 Operating income $ 29,207 $ 380 $ 29,587 Assets $ 235,873 $ 75,282 $311,155 Property, plant and equipment, net 43,935 41,351 85,286 Capital expenditures 10,310 5,339 15,649 (dollars in millions) 2016 Wireless Wireline Total Reportable Segments External Operating Revenues Service $ 66,362 $ — $ 66,362 Equipment 17,511 — 17,511 Other 4,915 — 4,915 Consumer Markets — 12,751 12,751 Enterprise Solutions — 9,162 9,162 Partner Solutions — 3,976 3,976 Business Markets — 3,356 3,356 Other — 314 314 Intersegment revenues 398 951 1,349 Total operating revenues 89,186 30,510 119,696 Cost of services 7,988 18,353 26,341 Wireless cost of equipment 22,238 — 22,238 Selling, general and administrative expense 19,924 6,476 26,400 Depreciation and amortization expense 9,183 5,975 15,158 Total operating expenses 59,333 30,804 90,137 Operating income (loss) $ 29,853 $ (294) $ 29,559 Assets $ 211,345 $ 66,679 $278,024 Property, plant and equipment, net 42,898 40,205 83,103 Capital expenditures 11,240 4,504 15,744 2017 Annual Report | Verizon Communications Inc. and Subsidiaries 93
Purchased from Demo (abedemo.tizrapublisher.com) for the exclusive use of unknown.
© 2026 Demo. Please report unauthorized use to pirate@tizra.com