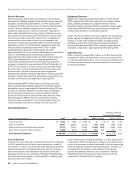
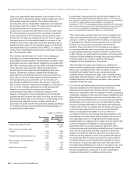
Management’s Discussion and Analysis of Financial Condition and Results of Operations continued Cash Flows Provided By Operating Activities Our primary source of funds continues to be cash generated from operations, primarily from our Wireless segment. Net cash provided by operating activities during 2017 increased by $2.5 billion primarily due to an increase in earnings and changes in working capital, partially offset by our discretionary contributions to qualified pension plans of $3.4 billion (approximately $2.1 billion, net of tax benefit) and the change in the method in which we monetize device payment plan receivables, as discussed below. As a result of the discretionary pension contribution in 2017, our mandatory pension funding through 2020 is expected to be minimal, which will benefit future cash flows. Further, the funded status of our qualified pension plan is improved. Net cash provided by operating activities during 2016 decreased by $16.2 billion primarily due to a change in the method by which we monetize device payment plan receivables, as discussed below, as well as a decline in earnings, an increase in income taxes paid primarily as a result of the Access Line Sale and the fact that in 2015 we received $2.4 billion of cash proceeds as a result of our transaction (Tower Monetization Transaction) with American Tower Corporation (American Tower). We completed the Tower Monetization Transaction in March 2015, pursuant to which American Tower acquired the exclusive rights to lease and operate approximately 11,300 of our wireless towers for an upfront payment of $5.0 billion, of which $2.4 billion related to a portion of the towers for which the right-of-use has passed to the tower operator. See Note 2 to the consolidated financial statements for additional information. During 2016, we changed the strategic method by which we monetize device payment plan receivables from sales of device payment plan receivables, which were recorded within cash flows provided by operating activities, to asset- backed debt transactions, which are recorded in cash flows from financing activities. During 2016 and 2015, we received cash proceeds related to sales of wireless device payment plan agreement receivables of approximately $2.0 billion and $7.2 billion, respectively. See Note 7 to the consolidated financial statements for additional information. During 2017 and 2016, we received proceeds from asset-backed debt transactions of approximately $4.3 billion and $5.0 billion, respectively. See Note 6 to the consolidated financial statements and “Cash Flows Used in Financing Activities” for additional information. Cash Flows Used In Investing Activities Capital Expenditures Capital expenditures continue to relate primarily to the use of capital resources to facilitate the introduction of new products and services, enhance responsiveness to competitive challenges and increase the operating efficiency and productivity of our networks. Capital expenditures, including capitalized software, were as follows: (dollars in millions) Years Ended December 31, 2017 2016 2015 Wireless $ 10,310 $ 11,240 $ 11,725 Wireline 5,339 4,504 5,049 Other 1,598 1,315 1,001 $ 17,247 $ 17,059 $ 17,775 Total as a percentage of revenue 13.7% 13.5% 13.5% Capital expenditures decreased at Wireless in 2017 and 2016 primarily due to the shift in investments to fiber assets, which support the densification of our 4G LTE network and pre-position us for 5G technology deployment. Capital expenditures increased at Wireline in 2017 primarily as a result of an increase in investments to support our multi-use fiber deployment. Capital expenditures declined at Wireline in 2016 as a result of the avoidance of capital expenditures related to the assets included in the Access Line Sale that were sold to Frontier in April 2016, and reduced capital spending during the 2016 Work Stoppage. Acquisitions During 2017, 2016 and 2015, we invested $0.6 billion, $0.5 billion and $9.9 billion, respectively, in acquisitions of wireless licenses. During 2017, 2016 and 2015, we also invested $5.9 billion, $3.8 billion and $3.5 billion, respectively, in acquisitions of businesses, net of cash acquired. 30 verizon.com/2017AnnualReport
Purchased from Demo (abedemo.tizrapublisher.com) for the exclusive use of unknown.
© 2026 Demo. Please report unauthorized use to pirate@tizra.com