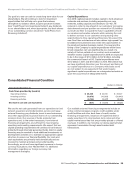
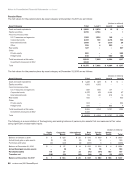
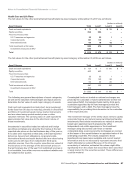
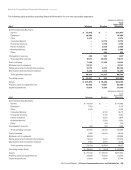
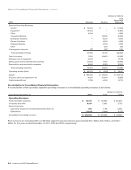
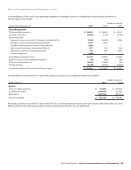
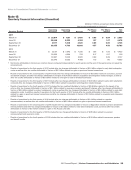
Notes to Consolidated Financial Statements continued The following table presents the balances of assets and liabilities measured at fair value on a recurring basis as of December 31, 2016: (dollars in millions) Level 1 (1) Level 2 (2) Level 3 (3) Total Assets: Other assets: Equity securities $ 123 $ — $ — $ 123 Fixed income securities 10 566 — 576 Interest rate swaps — 71 — 71 Cross currency swaps — 45 — 45 Interest rate caps — 10 — 10 Total $ 133 $ 692 $ — $ 825 Liabilities: Other liabilities: Interest rate swaps $ — $ 236 $ — $ 236 Cross currency swaps — 1,803 — 1,803 Total $ — $ 2,039 $ — $ 2,039 (1) quoted prices in active markets for identical assets or liabilities (2) observable inputs other than quoted prices in active markets for identical assets and liabilities (3) no observable pricing inputs in the market Equity securities consist of investments in common stock of domestic and international corporations measured using quoted prices in active markets. Fixed income securities consist primarily of investments in municipal bonds as well as U.S. Treasury securities. We used quoted prices in active markets for the majority of our U.S. Treasury securities, therefore these securities were classified as Level 1. For fixed income securities that do not have quoted prices in active markets, we use alternative matrix pricing resulting in these debt securities being classified as Level 2. Derivative contracts are valued using models based on readily observable market parameters for all substantial terms of our derivative contracts and thus are classified within Level 2. We use mid-market pricing for fair value measurements of our derivative instruments. Our derivative instruments are recorded on a gross basis. We recognize transfers between levels of the fair value hierarchy as of the end of the reporting period. There were no transfers between Level 1 and Level 2 during 2017 and 2016. Fair Value of Short-term and Long-term Debt The fair value of our debt is determined using various methods, including quoted prices for identical terms and maturities, which is a Level 1 measurement, as well as quoted prices for similar terms and maturities in inactive markets and future cash flows discounted at current rates, which are Level 2 measurements. The fair value of our short-term and long-term debt, excluding capital leases, was as follows: (dollars in millions) At December 31, 2017 2016 Carrying Amount Fair Value Carrying Amount Fair Value Short- and long-term debt, excluding capital leases $116,075 $128,658 $107,128 $117,584 Derivative Instruments The following table sets forth the notional amounts of our outstanding derivative instruments: (dollars in millions) At December 31, 2017 2016 Interest rate swaps $ 20,173 $ 13,099 Cross currency swaps 16,638 12,890 Interest rate caps 2,840 2,540 Interest Rate Swaps We enter into interest rate swaps to achieve a targeted mix of fixed and variable rate debt. We principally receive fixed rates and pay variable rates based on the LIBOR, resulting in a net increase or decrease to Interest expense. These swaps are designated as fair value hedges and hedge against interest rate risk exposure of designated debt issuances. We record the interest rate swaps at fair value on our consolidated balance sheets as assets and liabilities. Changes in the fair value of the interest rate swaps are recorded to Interest expense, which are offset by changes in the fair value of the hedged debt due to changes in interest rates. During 2017, we entered into interest rate swaps with a total notional value of $7.5 billion and settled interest rate swaps with a total notional value of $0.5 billion. During 2016, we entered into interest rate swaps with a total notional value of $6.3 billion and settled interest rate swaps with a total notional value of $0.9 billion. 2017 Annual Report | Verizon Communications Inc. and Subsidiaries 79
Purchased from Demo (abedemo.tizrapublisher.com) for the exclusive use of unknown.
© 2026 Demo. Please report unauthorized use to pirate@tizra.com