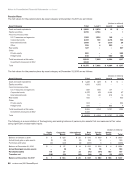
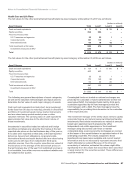
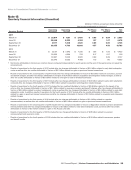
Notes to Consolidated Financial Statements continued The net pre-tax severance, pension and benefit charges during 2016 were comprised of a net pre-tax pension remeasurement charge of $0.2 billion measured as of March 31, 2016 related to settlements for employees who received lump-sum distributions in one of our defined benefit pension plans, a net pre-tax pension and benefit remeasurement charge of $0.8 billion measured as of April 1, 2016 related to curtailments in three of our defined benefit pension and one of our other postretirement plans, a net pre-tax pension and benefit remeasurement charge of $2.7 billion measured as of May 31, 2016 in two defined benefit pension plans and three other postretirement benefit plans as a result of our accounting for the contractual healthcare caps and bargained for changes, a net pre-tax pension remeasurement charge of $0.1 billion measured as of May 31, 2016 related to settlements for employees who received lump-sum distributions in three of our defined benefit pension plans, a net pre-tax pension remeasurement charge of $0.6 billion measured as of August 31, 2016 related to settlements for employees who received lump-sum distributions in five of our defined benefit pension plans, and a net pre-tax pension and benefit credit of $1.9 billion as a result of our fourth quarter remeasurement of our pension and other postretirement assets and liabilities based on updated actuarial assumptions. During 2015, we recorded net pre-tax severance, pension and benefit credits of approximately $2.3 billion primarily for our pension and postretirement plans in accordance with our accounting policy to recognize actuarial gains and losses in the year in which they occur. The credits were primarily driven by an increase in our discount rate assumption used to determine the current year liabilities from a weighted-average of 4.2% at December 31, 2014 to a weighted-average of 4.6% at December 31, 2015 ($2.5 billion), the execution of a new prescription drug contract during 2015 ($1.0 billion) and a change in mortality assumptions primarily driven by the use of updated actuarial tables (MP-2015) issued by the Society of Actuaries ($0.9 billion), partially offset by the difference between our estimated return on assets of 7.25% at December 31, 2014 and our actual return on assets of 0.7% at December 31, 2015 ($1.2 billion), severance costs recorded under our existing separation plans ($0.6 billion) and other assumption adjustments ($0.3 billion). Note 11 Taxes The components of income before benefit (provision) for income taxes are as follows: (dollars in millions) Years Ended December 31, 2017 2016 2015 Domestic $ 19,645 $ 20,047 $ 27,639 Foreign 949 939 601 Total $ 20,594 $ 20,986 $ 28,240 The components of the (benefit) provision for income taxes are as follows: (dollars in millions) Years Ended December 31, 2017 2016 2015 Current Federal $ 3,630 $ 7,451 $ 5,476 Foreign 200 148 70 State and Local 677 842 803 Total 4,507 8,441 6,349 Deferred Federal (14,360) (933) 3,377 Foreign (66) (2) 9 State and Local (37) (128) 130 Total (14,463) (1,063) 3,516 Total income tax (benefit) provision $ (9,956) $ 7,378 $ 9,865 The following table shows the principal reasons for the difference between the effective income tax rate and the statutory federal income tax rate: Years Ended December 31, 2017 2016 2015 Statutory federal income tax rate 35.0% 35.0% 35.0% State and local income tax rate, net of federal tax benefits 1.6 2.2 2.1 Affordable housing credit (0.6) (0.7) (0.5) Employee benefits including ESOP dividend (0.5) (0.5) (0.4) Impact of tax reform re- measurement (81.6) — — Noncontrolling interests (0.6) (0.6) (0.5) Non-deductible goodwill 1.0 2.2 — Other, net (2.6) (2.4) (0.8) Effective income tax rate (48.3)% 35.2% 34.9% 2017 Annual Report | Verizon Communications Inc. and Subsidiaries 89
Purchased from Demo (abedemo.tizrapublisher.com) for the exclusive use of unknown.
© 2026 Demo. Please report unauthorized use to pirate@tizra.com