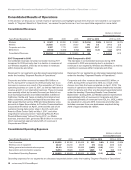
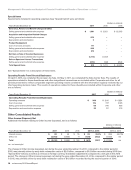
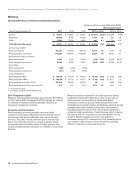
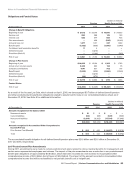
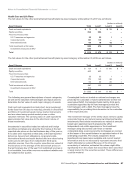
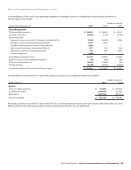
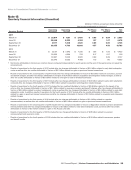
Management’s Discussion and Analysis of Financial Condition and Results of Operations continued The operating results and statistics for all periods presented below exclude the results of the Access Line Sale in 2016, the Data Center Sale in 2017, and other insignificant transactions (see “Operating Results from Divested Businesses”). The results were adjusted to reflect comparable segment operating results consistent with the information regularly reviewed by our chief operating decision maker. Operating Revenues and Selected Operating Statistics (dollars in millions) Increase/(Decrease) Years Ended December 31, 2017 2016 2015 2017 vs. 2016 2016 vs. 2015 Consumer Markets $ 12,777 $ 12,751 $ 12,696 $ 26 0.2% $ 55 0.4% Enterprise Solutions 9,167 9,164 9,378 3 — (214) (2.3) Partner Solutions 4,917 4,927 5,189 (10) (0.2) (262) (5.0) Business Markets 3,585 3,356 3,553 229 6.8 (197) (5.5) Other 234 312 334 (78) (25.0) (22) (6.6) Total Operating Revenues $ 30,680 $ 30,510 $ 31,150 $ 170 0.6 $ (640) (2.1) Connections (‘000):(1) Total voice connections 12,821 13,939 15,035 (1,118) (8.0) (1,096) (7.3) Total Broadband connections 6,959 7,038 7,085 (79) (1.1) (47) (0.7) Fios Internet subscribers 5,850 5,653 5,418 197 3.5 235 4.3 Fios video subscribers 4,619 4,694 4,635 (75) (1.6) 59 1.3 (1) As of end of period Wireline’s revenues increased $0.2 billion, or 0.6%, during 2017 compared to 2016, primarily due to increases in Business Markets, as a result of the acquisition of XO, and Fios revenues. The 2016 Work Stoppage negatively impacted revenue for the year ended December 31, 2016. Fios revenues were $11.7 billion during 2017 compared to $11.2 billion during 2016. During 2017, our Fios Internet subscriber base grew by 3.5% and our Fios Video subscriber base decreased by 1.6%, compared to 2016, reflecting the ongoing shift from traditional linear video to over the top offerings. Consumer Markets Consumer Markets operations provide broadband Internet and video services (including HSI, Fios Internet and Fios video services) and local and long distance voice services to residential subscribers. 2017 Compared to 2016 Consumer Markets revenues increased 0.2% during 2017 compared to 2016, due to increases in Fios revenues as a result of subscriber growth for Fios Internet services fueled by the introduction of gigabit speed data services, as well as higher pay-per-view sales due to marquee events during the third quarter, partially offset by the continued decline of voice service and HSI revenues. Consumer Fios revenues increased $0.4 billion, or 3.7%, during 2017 compared to 2016. Fios represented approximately 85% of Consumer revenue during 2017 compared to approximately 82% during 2016. The decline in voice service revenues was primarily due to a 7.5% decline in retail residence voice connections resulting primarily from competition and technology substitution with wireless, competing voice over Internet Protocol (VoIP) and cable telephony services. Total voice connections include traditional switched access lines in service, as well as Fios digital voice connections. 2016 Compared to 2015 Consumer Markets revenues increased $0.1 billion, or 0.4%, during 2016 compared to 2015, due to increases in Fios revenues as a result of subscriber growth for Fios services, partially offset by the continued decline of voice service revenues. Our Fios connection growth for 2016 was impacted by the 2016 Work Stoppage. Consumer Fios revenues increased $0.4 billion, or 4.3%, during 2016 compared to 2015. Fios represented approximately 82% of Consumer revenue during 2016 compared to approximately 79% during 2015. The decline of voice service revenues was primarily due to a 7.5% decline in retail residence voice connections resulting primarily from competition and technology substitution with wireless, competing VoIP and cable telephony services. Total voice connections include traditional switched access lines in service as well as Fios digital voice connections. 22 verizon.com/2017AnnualReport
Purchased from Demo (abedemo.tizrapublisher.com) for the exclusive use of unknown.
© 2026 Demo. Please report unauthorized use to pirate@tizra.com