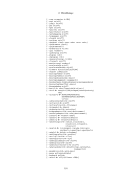
12 Troubleshooting • A debugger console window displayed alongside the VM • Via the telnet protocol at port 5000 The debugger can be enabled in three ways: • Start the VM directly using VirtualBox --startvm, with an additional --dbg, --debug, or --debug-command-line argument. See the VirtualBox usage help for details. • Set the VBOX_GUI_DBG_ENABLED or VBOX_GUI_DBG_AUTO_SHOW environment variable to true before launching the VirtualBox process. Setting these variables (only their presence is checked) is effective even when the first VirtualBox process is the VM selector window. VMs subsequently launched from the selector will have the debugger enabled. • Set the GUI/Dbg/Enabled extra data item to true before launching the VM. This can be set globally or on a per VM basis. A new ’Debug’ menu entry will be added to the VirtualBox application. This menu allows the user to open the debugger console. The VM debugger command syntax is loosely modeled on Microsoft and IBM debuggers used on DOS, OS/2 and Windows. Users familiar with symdeb, CodeView, or the OS/2 kernel debug- ger will find the VirtualBox VM debugger familiar. The most important command is help. This will print brief usage help for all debugger com- mands. The set of commands supported by the VM debugger changes frequently and the help command is always up-to-date. A brief summary of frequently used commands follows: • stop – stops the VM execution and enables single stepping • g – continue VM execution • t – single step an instruction • rg/rh/r – print the guest/hypervisor/current registers • kg/kh/k – print the guest/hypervisor/current call stack • da/db/dw/dd/dq – print memory contents as ASCII/bytes/words/dwords/qwords • u – unassemble memory • dg – print the guest’s GDT • di – print the guest’s IDT • dl – print the guest’s LDT • dt – print the guest’s TSS • dp* – print the guest’s page table structures • bp/br – set a normal/recompiler breakpoint • bl – list breakpoints • bc – clear a breakpoint • writecore – writes a VM core file to disk, refer chapter 12.1.4, VM core format, page 167 166
Purchased from Demo (abedemo.tizrapublisher.com) for the exclusive use of unknown.
© 2026 Demo. Please report unauthorized use to pirate@tizra.com