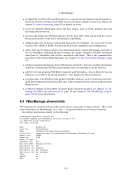
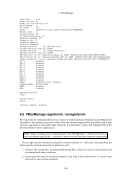
8 VBoxManage By default no metrics are collected at all. Metrics collection does not start until VBoxManage metrics setup is invoked with a proper sampling interval and the number of metrics to be re- tained. The interval is measured in seconds. For example, to enable collecting the host processor and memory usage metrics every second and keeping the 5 most current samples, the following command can be used: VBoxManage metrics setup --period 1 --samples 5 host CPU/Load,RAM/Usage Metric collection can only be enabled for started VMs. Collected data and collection settings for a particular VM will disappear as soon as it shuts down. Use VBoxManage metrics list subcommand to see which metrics are currently available. You can also use --list option with any subcommand that modifies metric settings to find out which metrics were affected. Note that the VBoxManage metrics setup subcommand discards all samples that may have been previously collected for the specified set of objects and metrics. To enable or disable metrics collection without discarding the data VBoxManage metrics enable and VBoxManage metrics disable subcommands can be used. Note that these sub- commands expect metrics, not submetrics, like CPU/Load or RAM/Usage as parameters. In other words enabling CPU/Load/User while disabling CPU/Load/Kernel is not supported. The host and VMs have different sets of associated metrics. Available metrics can be listed with VBoxManage metrics list subcommand. A complete metric name may include an aggregate function. The name has the following form: Category/Metric[/SubMetric][:aggregate]. For example, RAM/Usage/Free:min stands for the minimum amount of available memory over all retained data if applied to the host object. Subcommands may apply to all objects and metrics or can be limited to one object or/and a list of metrics. If no objects or metrics are given in the parameters, the subcommands will apply to all available metrics of all objects. You may use an asterisk (“*“) to explicitly specify that the command should be applied to all objects or metrics. Use “host” as the object name to limit the scope of the command to host-related metrics. To limit the scope to a subset of metrics, use a metric list with names separated by commas. For example, to query metric data on the CPU time spent in user and kernel modes by the virtual machine named “test”, you can use the following command: VBoxManage metrics query test CPU/Load/User,CPU/Load/Kernel The following list summarizes the available subcommands: list This subcommand shows the parameters of the currently existing metrics. Note that VM- specific metrics are only available when a particular VM is running. setup This subcommand sets the interval between taking two samples of metric data and the number of samples retained internally. The retained data is available for displaying with the query subcommand. The --list option shows which metrics have been modified as the result of the command execution. enable This subcommand “resumes” data collection after it has been stopped with disable subcommand. Note that specifying submetrics as parameters will not enable underlying metrics. Use --list to find out if the command did what was expected. disable This subcommand “suspends” data collection without affecting collection parameters or collected data. Note that specifying submetrics as parameters will not disable underlying metrics. Use --list to find out if the command did what was expected. query This subcommand retrieves and displays the currently retained metric data. Note: The query subcommand does not remove or “flush” retained data. If you query often enough you will see how old samples are gradually being “phased out” by new samples. 131
Purchased from Demo (abedemo.tizrapublisher.com) for the exclusive use of unknown.
© 2026 Demo. Please report unauthorized use to pirate@tizra.com